Candlesticks are created by up and down movements in the price. While these price movements sometimes appear random, at times, they sometimes tend to form "patterns" that traders find repetitive and detectable. These candlestick patterns over time have become popular for traders to use, due to their simplicity, elegance and natural interpretation of market sentiment.
Candlestick charts are believed to be one of the oldest types of charts, developed in Japan in the 18th century. Originally, candlestick formations were labeled according to the military environment of the Japanese feudal and military system during that time. Therefore you will find terms such as as “piercing”, “thrusting” and “three soldiers” which reflect this. But later, candles were also given other more mystical names which may sound unusual at first but which are actually very descriptive like the“dragonfly” or“morningstar”.

Below is a basic overview of some of the commonly used Candlestick Patterns on charts.
Single Candle Patterns

Doji: Formed when opening and closing prices are virtually the same. The lengths of shadows can vary.

Dragonfly Doji: Formed when the opening and the closing prices are at the highest of the day. If it has a longer lower shadow it signals a more bullish trend. When appearing at market bottoms it is considered to be a reversal signal.

Gravestone Doji: Formed when the opening and closing prices are at the lowest of the day. If it has a longer upper shadow it signals a bearish trend. When it appears at market top it is considered a reversal signal.
Hanging Man: A black or a white candlestick that consists of a small body near the high with a little or no upper shadow and a long lower tail. The lower tail should be two or three times the height of the body. Considered a bearish pattern during an uptrend.

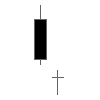
Hammer: A black or a white candlestick that consists of a small body near the high with a little or no upper shadow and a long lower tail. Considered a bullish pattern during a downtrend.

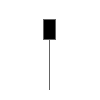
Marubozu: A long or a normal candlestick (black or white) with no shadow or tail. The high and the lows represent the opening and the closing prices. Considered a continuation pattern.

Shooting Star: A black or a white candlestick that has a small body, a long upper shadow and a little or no lower tail. Considered a bearish pattern in an uptrend.
Complex Patterns

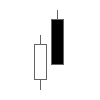
Bearish Harami: Consists of an unusually large white body followed by a small black body (contained within large white body). It is considered as a bearish pattern when preceded by an uptrend.

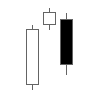
Bullish Harami: Consists of an unusually large black body followed by a small white body (contained within large black body). It is considered as a bullish pattern when preceded by a downtrend.
Dark Cloud Cover: Consists of a long white candlestick followed by a black candlestick that opens above the high of the white candlestick and closes well into the body of the white candlestick. It is considered as a bearish reversal signal during an uptrend.

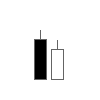
Bearish Engulfing: Consists of a small white body that is contained within the followed large black candlestick. When it appears at top it is considered as a major reversal signal.

Bullish Engulfing: Consists of a small black body that is contained within the followed large white candlestick. When it appears at bottom it is interpreted as a major reversal signal.

Evening Doji Star: Consists of three candlesticks. First is a large white body candlestick followed by a Doji that gap above the white body. The third candlestick is a black body that closes well into the white body. When it appears at the top it is considered as a reversal signal. It signals more bearish trend than the evening star pattern because of the doji that has appeared between the two bodies.
Evening Star: Consists of a large white body candlestick followed by a small body candlestick (black or white) that gaps above the previous. The third is a black body candlestick that closes well within the large white body. It is considered as a reversal signal when it appears at top level.

Morning Doji Star: Consists of a large black body candlestick followed by a Doji that occurred below the preceding candlestick. On the following day, a third white body candlestick is formed that closed well into the black body candlestick which appeared before the Doji. It is considered as a major reversal signal that is more bullish than the regular morning star pattern because of the existence of the Doji.

Morning Star: Consists of a large black body candlestick followed by a small body (black or white) that occurred below the large black body candlestick. On the following day, a third white body candlestick is formed that closed well into the black body candlestick. It is considered as a major reversal signal when it appears at bottom.

Three Black Crows: Consists of three long black candlesticks with consecutively lower closes. The closing prices are near to or at their lows. When it appears at top it is considered as a top reversal signal.
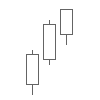
Three White Soldiers: Consists of three long white candlesticks with consecutively higher closes. The closing prices are near to or at their highs. When it appears at bottom it is interpreted as a bottom reversal signal.
Tweezer Bottoms: Consists of two or more candlesticks with matching bottoms. The candlesticks may or may not be consecutive and the sizes or the colours can vary. It is considered as a minor reversal signal that becomes more important when the candlesticks form another pattern.

Tweezer Tops: Consists of two or more candlesticks with matching tops. The candlesticks may or may not be consecutive and the sizes or the colours can vary. It is considered as a minor reversal signal that becomes more important when the candlesticks form another pattern.
Doji Star: Consists of a black or a white candlestick followed by a Doji that gap above or below these. It is considered as a reversal signal with confirmation during the next trading day.

Piercing Line: Consists of a black candlestick followed by a white candlestick that opens lower than the low of preceding but closes more than halfway into black body candlestick. It is considered as reversal signal when it appears at bottom.
In an upcoming series of articles, we'll give you a detailed analysis on how to trade profitably using these patterns. Watch out for this space!