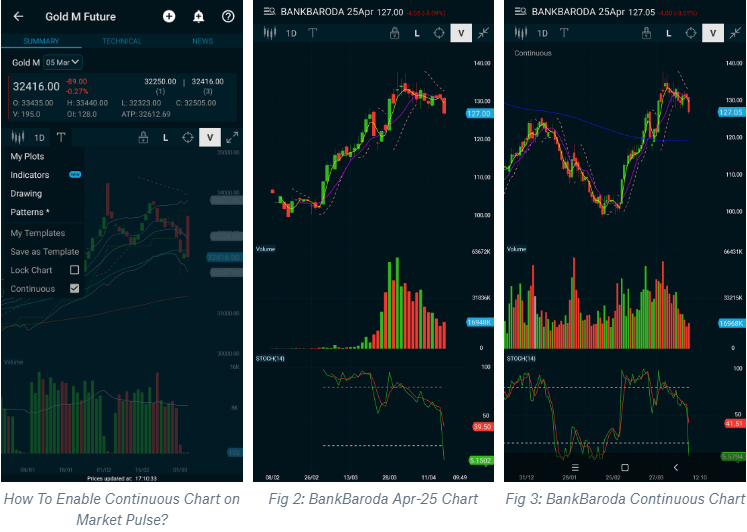
Understand the basics of continuous charts and how to avoid common mistakes when using them.
Why this new feature - Continuous Charts?
Most of the actively traded futures be it commodities or equities consist of a series of short duration contracts usually 3 months, which generally get very active only in the last month before expiry. As one contract expires, another is listed for trading, and so the cycle continues.
For example, the most active contract for Bank of Baroda in April, 2019 is BankBaroda-25Apr. This contract was introduced on 01-Feb-2019. But from Fig 2. we can observe that the pick up in volumes only started towards the end of March 2019. It would continue to be actively traded until April 25th when the contract will expire.

The problem with this contract arises when a trader is trying to view or analyse the longer term trends say for a year or create a trading system with hourly or daily data using technical analysis. She just does not have enough data to do any kind of meaningful analysis.
In equity, one can look a long-term history of prices by looking at cash market prices. But then, what do commodity traders do, where unlike equity, spot prices are not available?
To work around this issue and study futures charts over longer periods of time, Continuous charts were created.
What is a Continuous Chart?
A continuous futures chart is not a real futures contract. Instead, it is several previous futures contracts that have been stitched together to create a long-term chart of the price history as shown in Fig 3. for Bank of Baroda continuous chart. Here, only the near month active contracts are joined together month after month thus giving us data over a longer time frame with more comparable volumes and indicators like Moving Averages or Stochastic in this example. Thus, Continuous futures contracts provide a good means to assess the long-term trend. However, the chartist must bear in mind that the resulting chart will only be a computation of the price history and must understand its limitations.
It is important for us to first understand the different methods of constructing these charts first.
Methods of Constructing Continuous Charts with their Benefits & Challenges
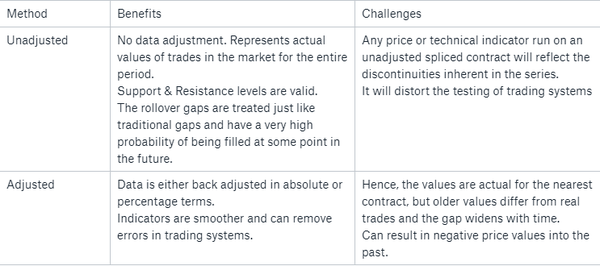
Unadjusted Continuous Chart on Market Pulse
After studying both methods, Market Pulse picked the unadjusted charting style as its choice for continuous charting, as we wanted to maintain the actual traded values on charts. We picked the rollover date as the day after the current contract expires and the continuous chart picks up the next nearest month contract for its data feed.
Advantage:
These charts have no adjustments made to the price scale during contract rollovers. For traders who create levels of support or resistance these unadjusted charts reflect prices that a previous contract of a particular Commodity or Stock Futures actually traded at, thus making levels more accurate.
Limitation:
Usually there is a gap associated with these rollovers because of the different prices of each Futures contract month. Any numerical price or technical indicator run on an unadjusted spliced contract will reflect the discontinuities inherent in the series. For instance, a moving average will jump along with every gap. To the extent that an indicator is used to assess market sentiment, it will provide a false reading, because the gaps in a spliced contract are not caused by market activity.
A spliced contract will distort the testing of trading systems and hence create false signals sometimes with scanners and alerts.
What is the solution
If you’re using the Scanner or the Alerts on Market Pulse, we recommend you to please double check for your indicator signals on spot market charts in the first few days after expiry, to ensure its not caused by gaps.
We strongly recommend you build your technical trading Strategies for Alerts and Scans for longer term chart durations (daily or longer) on the spot charts wherever possible and use the futures continuous charts only for viewing the trend.
Learnings:
Continuous Charts help us study longer term trends of futures prices by splicing together data from multiple previous contracts.
What you must watch out for?
Discontinuities in the indicators on your charts because of time premium differences of the contracts causing signal errors on Indicators, Scanner & Alerts.