The Chaikin Money Flow (CMF) was developed by Marc Chaikin to combine price and volume information into one indicator. It is based on the belief that price follows volume.
This article will cover :
- Indicator Rationale
- Calculation of CMF
- How to read CMF indicator
- How CMF works
Rationale for Chaikin's Money Flow Indicator
The CMF indicator concept is based on accumulation/distribution i.e. stock closes above its midpoint [(high+low)/2] for the day, then there was accumulation that day, and if it closes below its midpoint, then there was distribution that day. Going further, the nearer the closing price is to the high, the more accumulation has taken place. Conversely, the nearer the closing price is to the low, the more distribution has taken place.
- CMF indicator looks at two important factors to determine the likely sustainability of a price move:
- Has the stock been closing strong during this move?
- Has the move happened on relatively high or low volume?
Calculation of CMF
There are three steps to calculating Chaikin Money Flow.
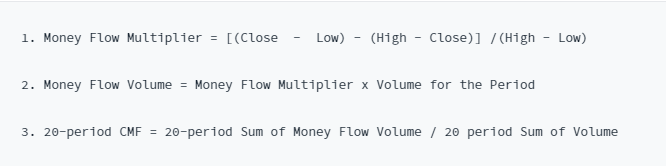
- Calculate the Money Flow Multiplier for each period This multiplier is positive when the close is in the upper half of the period's high-low range and negative when the close is in the lower half. The multiplier equals 1 when the close equals the high and -1 when the close equals the low. In this way, the multiplier adjusts the amount of volume that ends up in Money Flow Volume in step 2.
- Multiply the Money Flow Multiplier value by the period's volume to find Money Flow Volume.
- Third, sum Money Flow Volume for the 20 periods and divide by the 20-period sum of volume.
How to read CMF indicator
Chaikin Money Flow is an oscillator that fluctuates between -1 and +1. Rarely, if ever, will the indicator reach these extremes. It would take 20 consecutive closes on the high (low) for 20-day Chaikin Money Flow to reach +1 (-1). Typically, this oscillator fluctuates between -0.50 and +0.50 with 0 as the centerline.

How CMF works
- A CMF value above the zero line is a sign of strength in the market, and a value below the zero line is a sign of weakness in the market.
- Wait for the CMF to confirm the breakout direction of price action through trend lines or through support and resistance lines. For example, if a price breaks upward through resistance, wait for the CMF to have a positive value to confirm the breakout direction.
- CMF sell signal occurs when price action develops a higher high into overbought zones, with the CMF diverging with a lower high and beginning to fall.
- CMF buy signal occurs when price action develops a lower low into oversold zones, with the CMF diverging with a higher low and beginning to rise.

Drawback
The CMF has a major drawback. It makes an assumption that prices are moving from one session to the next smoothly. But in reality, we have gaps in the market, where prices open and trade in a completely new range on a new trading day. The CMF has no method to capture these gaps and can get out of synch.