Today, I want to talk about a new indicator we have introduced on the Market Pulse app that happens to be one of my favorites and one that you can depend upon for your intraday trading - the Camarilla Pivots.
This article will cover :
- What is Camarilla Pivots
- Benefits of Pivot Trading
- Camarilla Calculations
- Camarilla Trading Strategies
- Benefits of Pivot Trading
- Display of Pivots on Chart
Camarilla Pivots
Most of you are already aware of the Standard and Fibonacci Pivots used widely for intraday trading. The basic building block of these levels are that prices have a tendency to revert to their mean and the trader can use them to make the right entries and exits for profitable intraday trading.
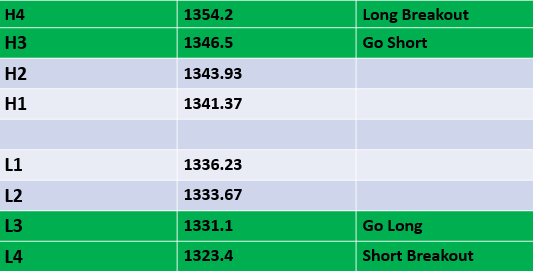
In the classic pivots, traders watch Resistance 1 and support 1 as the crucial levels. In Camarilla Pivot points, traders attach importance to third and fourth levels of Support and resistances as shown in the Fig.
Benefits of Pivot Trading
- Prepares the trader in advance with a game plan.
- Levels are generated automatically each trading day.
- Spots trigger points in bullish and bearish areas of the chart
- Clear entry and exit points.
- Identifies support and resistance;
Camarilla Calculations
Feel free to skip this section if the math doesn’t excite you.
The input parameters for Camarilla calculations are the Previous days Open, High, Low and Close.

The levels are calculated as follows:
R4 = Close + (High – Low) * 1.1/2
R3 = Close + (High – Low) * 1.1/4
R2 = Close + (High – Low) * 1.1/6
R1 = Close + (High – Low) * 1.1/12
S1 = Close – (High – Low) * 1.1/12
S2 = Close – (High – Low) * 1.1/6
S3 = Close – (High – Low) * 1.1/4
S4 = Close – (High – Low) * 1.1/2
Once a security either moves above R4 or below S4, means a breakout move and a trending move is likely towards R5/R6 on the upside and S5/S6 on downside which are calculated as follows:
R5 = R4 + 1.168 *(R4-R3)
R6 = (High/Low)* Close
S5 = S4 – 1.168 *(S3-S4)
S6 = Close – (R6 – Close)
Display of Pivots on Chart
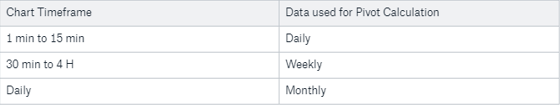
As a user of Pivots, you must be aware that the Pivot points displayed on your chart are calculated based on different data points.
For eg. If you are using an intraday chart up to 15 minutes, the pivot points are calculated based on the open, high, low, close of the previous trading day. If the chart setting is 30 minutes to 4 hours, the pivot points are calculated based on the open, high, low, close of the previous trading week’s data and similarly for daily charts the pivots are from the previous monthly candlestick data.
Camarilla Trading Strategies
There are 4 distinct scenarios that can occur when trading with Camarilla pivots:
- Scenario 1 - Open price is between H3 and L3
- Scenario 2 - Open price is between H3 and H4
- Scenario 3 - Open price is between L3 and L4
- Scenario 4 - Open price is outside H4 and L4
Scenario 1
Open price is between H3 and L3
For Long
Wait for the price to go below L3 and then when it moves back above L3, buy. Stoploss will be when price moves below L4. Target1 - H1, Target2 - H2, Target3 - H3
For Short Sell
Wait for the price to go above H3 and then when the price moves back below H3, sell. Stoploss will be when price moves above H4. Target1 - L1, Target2 - L2, Target3- L3
Scenario 2
Open price is between H3 and H4
For Long
When price moves above H4, buy. Stoploss when price goes below H3. Target 1 - H5, Target 2 - H6
For Short Sell
When the price goes below H3, sell. Stoploss when prices moves above H4. Target1 - L1, Target2 - L2, Target3- L3
Scenario 3
Open price is between L3 and L4
For Long
When price moves above L3, buy. Stoploss when price moves below L4. Target1 - H1, Target2 - H2, Target3 - H3
For Short Sell
When the price goes below L4, sell. Stoploss when price moves above L3. Target 1 - L5, Target 2 - L6
Scenario 4
Open price is outside the H4 and L4
Wait for the prices to come in range and trade accordingly.
Conclusion
Patience and discipline are key. Traders must wait for the levels to be reached before taking action. Once you are comfortable with trading the basic strategy, you can further experiment by combining it with SMA, EMA or the RSI to see if you can further improve your trading performance.
Trivia
Camarilla Pivot points was discovered by Nick Scott in 1989, a successful bond trader.
Famous Nick Scott Quotes
"If it ain’t broke, don’t fix it!
“Do the same dance as everyone else, just learn how to sit down BEFORE the music stops!"
"Most traders go broke because they can't adapt. They think they have found the'secret', and may even make money for a while, but then suddenly it stops working. They don't adapt, they just keep on trying the same old(now non-functional) trick until they run out of cash. The reason I'm Nick Scott and you are not is that I adapt on a daily basis. Adapt or die!”