Last week, we saw how Volume can be a powerful pointer for a trader to preempt price movements with the On Balance Indicator (OBV).
In this final edition on setting indicator combinations we’ll be looking at another powerful combination -
- The Supertrend, and
- The Money Flow Index (MFI), another oscillator that tracks price with volume.
We have covered the Supertrend in depth in Article 4 and Article 5 earlier in this series. So, let’s first understand the MFI and see how it can be incorporated into our strategy.

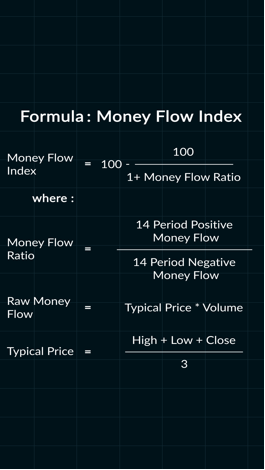
Money Flow Index
The Money Flow Index (MFI) is a typical oscillator (between 0 and 100) that uses price and volume for identifying overbought or oversold conditions in securities. As a momentum oscillator that incorporates volume, MFI works well to identify reversals and price extremes.
Comparison with RSI
As the MFI incorporates both price and volume data, as opposed to just price it has been referred to as the volume-weighted RSI.
The reason for this comparison is that MFI uses a similar formula to RSI. RSI uses the ratio of average gains to average losses, but the MFI incorporates a product of price and volume to calculate positive money flow and negative formula.
Interpretation
- Overbought and oversold levels can be used to identify price extremes. Typically, MFI above 80 is considered overbought and MFI below 20 is considered oversold. However, the levels may stay at extremes for extended periods in strong trends.
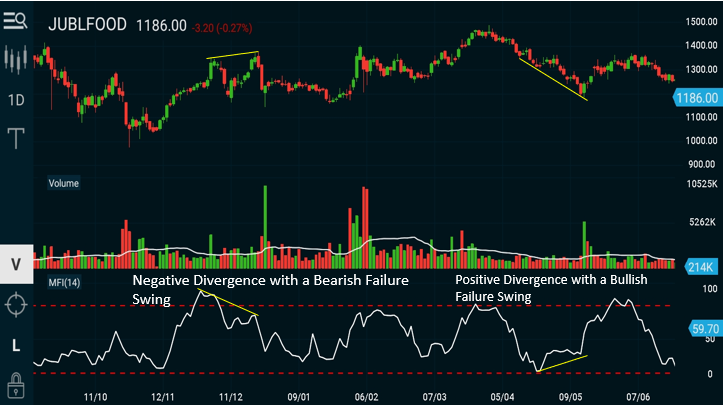
- Divergences and failure swings can create high probability signals.
- A bullish failure swing occurs when MFI becomes oversold below 20, surges above 20, holds above 20 on a pullback and then breaks above its prior reaction high.
- A bearish failure swing occurs when MFI becomes overbought above 80, plunges below 80, fails to exceed 80 on a bounce and then breaks below the prior reaction low.
Trading System with Supertrend & Money Flow Index
This is a trend following system designed to catch sustained trends that uses the oversold and overbought conditions on the MFI to find low risk entry points. The conditions that can be set for the alerts are as follows:
1) Long Entry
A long entry should be made when these conditions are met:
Daily Chart
- Supertrend (10,4) indicator is lower than Price AND
- MFI (9) crosses above 25 or 50
Stop Loss & Exit Condition
Supertrend crosses above Price
2) Short Entry
A short entry should be made when these conditions are met:
Daily Chart
- Supertrend (10,4) indicator is higher than Price AND
- MFI (9) crosses below 75 or 50
Stop Loss
Supertrend crosses below Price
Exit Condition
One needs to be nimble to make money on the short side. I use the signal of MFI crosses above 20 or 25 after getting oversold as a signal to book my profits.
I have kept the MFI(9) condition flexible on this strategy. I recommend you back test for different stocks with values of MFI(9) between 20 to 50 for the stocks of your interest and set alerts accordingly. As this is a longer term strategy, MFI can behave differently with different securities.
Case Study
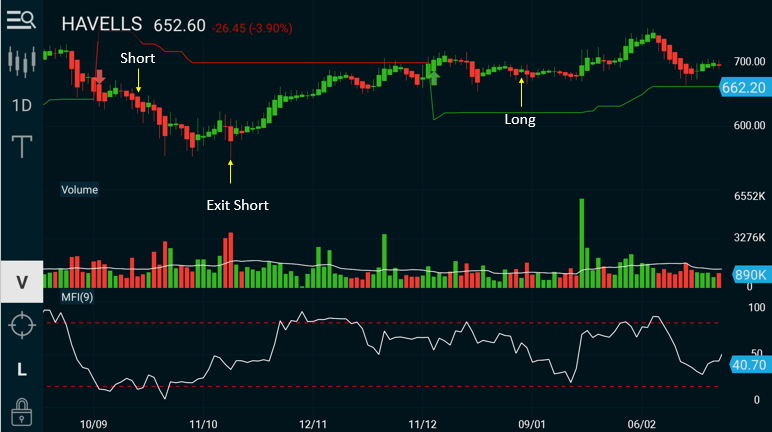
chose to use MFI(9) value of 50 for both long and short as the crossover If we look at the Daily chart for HAVELLS over the last year, the strategy produced only 2 signals.
- 21 Sep 2018: Short @ 635.0511
- Oct 2018: Short Covered @ 611
- 01 Jan 2019: Long @ 694.8010
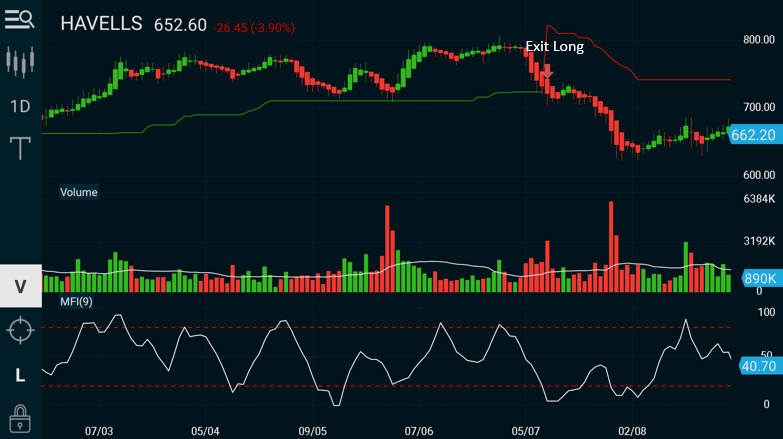
- Jul 2019: Sold @ 726.55
Both the trades were profitable.
In comparison, if you followed either a Buy or Hold Strategy or a pure Supertrend strategy would have resulted in negative returns over the same period.
Conclusion
The MFI is an excellent momentum oscillator that can be used in conjunction with a trending indicator like Supertrend or even a moving average crossover system. However, I would never recommend using it in isolation as a single indicator as there is a tendency to produce false signals.
Closing Note on Indicator Strategies
One must remember, that no matter which strategy or indicators you pick, they must work smoothly with your style and psychology of trading. For example, if your style is day trading, using a 100 or a 200 day moving average may be too long. If your orientation is long-term, using a 5 or a 10 day moving average may not work for you.
Indicators are useful but only if you understand their limitations. Whatever indicators you pick, make sure you backtest or paper trade it thoroughly over different kinds of market conditions before deploying capital on it.
All the best!