Hello folks!
I hope you’ve been enjoying this series on indicator combinations so far. This week, we are going to reveal an intraday trading strategy with a new pairing - Aroon oscillator with a moving average crossover. Let’s dive right in.
Aroon Oscillator
The word“Aroon” has its origin in Sansktrit meaning“The early light of dawn”. The indicator’s developer Tushar Chande coined this name as it is designed to reveal the beginning of a new trend.
The Aroon can help a trader to get into a trend early and exit when the trend shows signs of stopping. On the contrary, if you like to trade a range, you can also use an Aroon strategy to create a solid counter-trend trading system. Hence, it has proved to be consistently profitable for day traders.
Primarily, the Aroon Oscillator measures the strength of a trend and its possibility of continuation.
The Aroon Up and Aroon Down lines are the percentage amount of time between the start of a time period and the point where the highest and lowest price during that period reached, respectively.

Formula
By default, Aroon Up and Aroon Down are calculated as the number of periods since the last 25-period high and low respectively. I recommend the default setting of 25. However, you can vary the time period and try different settings.
Aroon Up = 100∗ (25− No. of Periods Since 25-Period High)/25
Aroon Down = 100∗ (25− No. of Periods Since 25-Period Low)/25
Interpretation
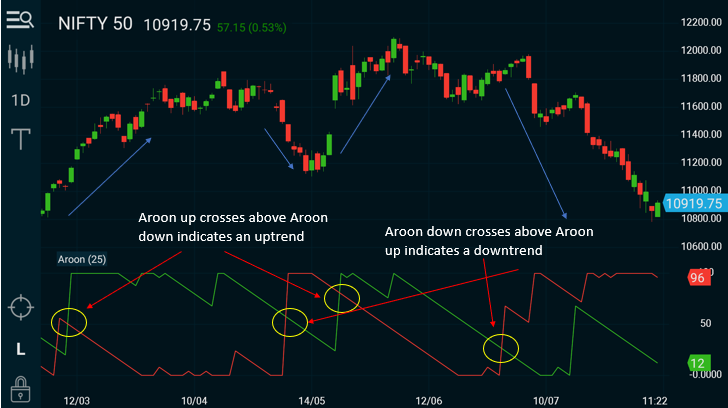
Aroon Up above indicates a strong uptrend whereas Aroon Down above points to a downtrend.
One must watch for the crossover of the Aroon up and Aroon Down which signal potential trend changes.
Key Observations
- When the market changes from bullish to bearish, the Aroon Up crosses above Aroon Down.
- When the market changes from bearish to bullish, the Aroon Down crosses above Aroon Up.
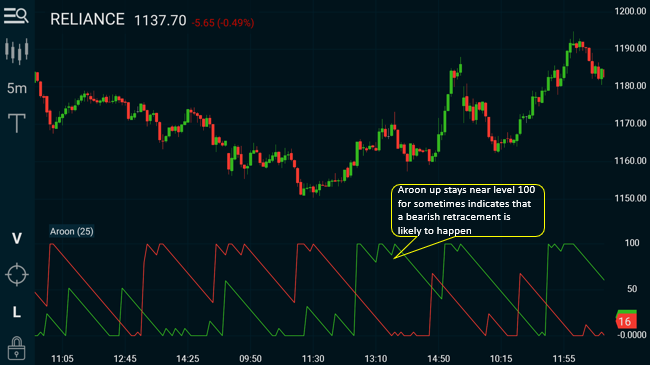
- When the market is trending with strong momentum, the Aroon Up will display extreme readings for an uptrend and Aroon Down will display extreme readings for a downtrend.
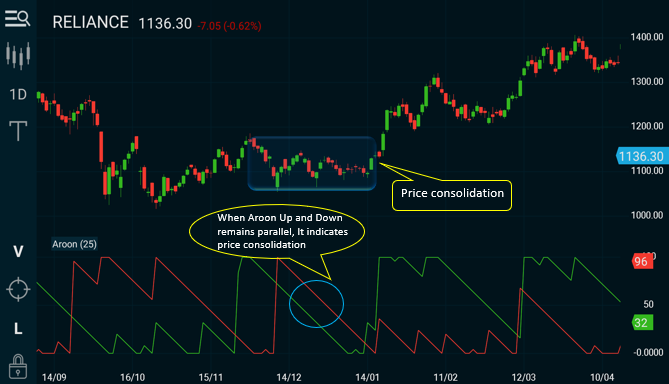
- Lastly, when the market is sideways, the Aroon Up and Aroon Down lines will be parallel to each other.
Combining another indicator with Aroon
If you analyze the Aroon formulae, you will note that there is only one parameter, time period. There is no reference to the price itself. So this indicator gives you trend and momentum in terms of time. Ideally, you would want to recommend, some kind of price action analysis like Candlestick patterns or moving averages.
Moving Average Crossover
We will be combining the Aroon with a moving average crossover in our strategy.
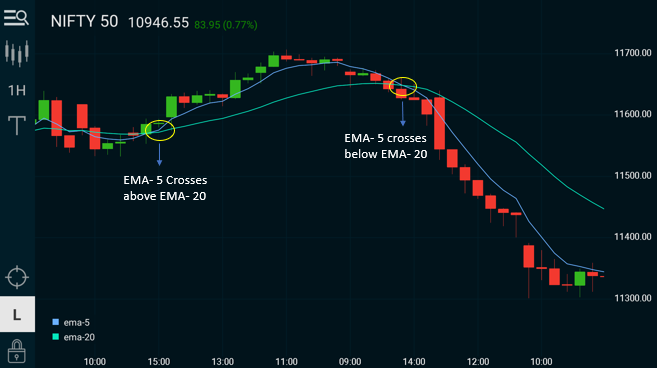
A crossover occurs when a faster Moving Average (i.e. a shorter period Moving Average) crosses either above a slower Moving Average (i.e. a longer period Moving Average) which is considered a bullish crossover or crosses below which is considered a bearish crossover as shown in the fig.
You can read in detail above Moving averages from this earlier article.
Aroon & EMA Crossover Strategy
This is an intraday strategy and we’ll be using it on a 15 mins intraday chart.
Trade Setup
Timeframe: 15 mins
Indicator settings: Aroon (period: 25), EMA (periods: 5,20).Stop Loss: set the
Stop Loss: below the day’s low/high and trail tightly once target is achieved.Take
Take Profit: Book profits at 2x-3x of your stop loss or trail tightly once target achieved. Avoid carrying overnight positions.
Buy Entry Rule 1
- Aroon Up crosses above Aroon Down.
- 5 EMA is higher than 20 EMA
Buy Entry Rule 2
- Aroon Up is higher than Aroon Down.
- 5 EMA crosses above 20 EMA
Sell Entry Rule 1
- Aroon Up crosses below Aroon Down.
- 5 EMA is lower than 20 EMA
Sell Entry Rule 2
- Aroon Up is lower than Aroon Down.
- 5 EMA crosses below 20 EMA
If you notice, we have 2 different sets of conditions for buy and sell here. The reason - we want to ensure that when one of the indicator crossover signal occurs, the other has already satisfied it. If we set up both crossovers in the same condition, the chances of that occurring together are very rare and we can miss out on a lot of trades.
I have kept the take profit condition a little flexible as this will be used in a day trading strategy and the traders need to act quickly to protect their profits. Stop losses are clearly defined.
Position traders can explore this strategy on higher timeframes like 60 mins or daily too.
Conclusion
The Aroon is an excellent time based indicator that can be combined with many other indicators and breakouts as well. Try them on your charts and see for yourself. See you next week!