In this second installment of “Building Trading Strategies” we begin our journey on learning swing trading using the Parabolic SAR as a trend indicator and Stochastic to confirm the momentum.
In our introductory post, I gave you an overview on the guidelines one needs to follow when you use and combine indicators on charts. If you didn't read the last article, you'll probably want to review it before tackling this one.
Today, we are going to deep dive into our first indicator combination strategy with a trend indicator(Parabolic Sar) and a momentum indicator(Stochastic). The strategy is designed so one can enter in the direction of the main trend once it gains momentum in that direction. It’s a purely discretionary strategy which is best deployed on the hourly chart for signals. This is a short term strategy which is good for intraday trading as well as a swing trade with a 5-7 days horizon.
How to combine PSAR and Stochastic Oscillator
The indicators deployed for this strategy are:
- The Stochastic oscillator is set to the default parameters of 14 for the fast moving line (%K) and 3 for the slow moving line (%D). For our strategy, along with the regular stochastic levels of overbought (80) and oversold (20), we will monitor the mid-point of the oscillator at 50.
- The Parabolic SAR indicator for our strategy is set at (0.05, 0.5). I have modified the step and max AF levels of the PSAR from the default of (0.02,0.2), the reason being by increasing the sensitivity of the Indicator, we can get a quicker and more frequent signals for a trend reversal. Since we are combining two indicators, we are not acting on the PSAR alone, we don’t face the risk of getting choppy signals.
The Strategy
This strategy uses the Parabolic SAR indicator to pick out the trend and using the Stochastics oscillator for the confirmation for the trade. This is because the 50 mark is the halfway point of the momentum oscillator. An increasing Stochastic value between the oversold(20) level and the 50 mark is deemed to be bullish while a decreasing Stochastic value between the overbought(80) level and the 50 mark is deemed to be bearish.
Cautious traders sometime use multiple time period analysis to pick the larger trend direction from the daily chart. However, we will not use it for this current strategy.
1) Strategy for trading : Long Entry
A long entry should be made in the following circumstances:
Hourly Chart
- Fast Stochastic oscillator line (%K) is above 20 and below 50.
- %K is greater than %D. The Stochastic is in an increasing trend
- Parabolic SAR indicator signal crossover to Bullish signal in the last 5 bars.
- Open the long trade at the open of the next candle.
Stop Loss:
Place the stop loss just below the swing low or 2% whichever is higher below the current market price at the start of the trade. This stop loss can be trailed with the market.
Take Profit:
The TP point can be set to 7% from your entry price can be ideal for positional traders. However, another way of taking profits especially for intraday traders may be to wait for the Stochastic oscillator to reverse after reaching overbought levels before taking partial or full profits as the case may be.
2) Strategy for trading : Short Entry
A short entry should be made in the following circumstances:
Hourly Chart
- Fast Stochastic oscillator line (%K) is below 80 and above 50.
- %K is less than %D. The Stochastic is in a decreasing trend
- Parabolic SAR indicator signal crossover to Bearish signal in the last 5 bars.
- Open the short trade at the open of the next candle.
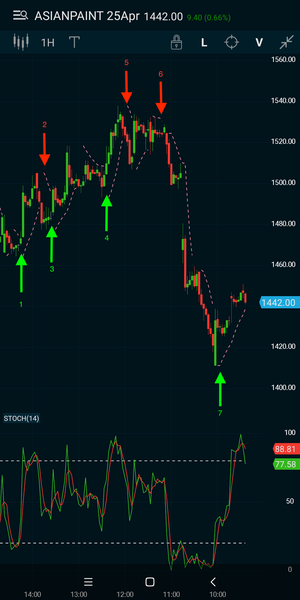
The short trade setup is also shown in this snapshot above with red arrows. Here, we can see that the trade entry sets itself up very well and the stock moved quite well too before it headed into oversold territory. This is where the trader can set the trade exit.

Stop Loss:
The positional trader should set the stop loss at 2% above his entry level or above the swing high whichever is higher.
Take Profit:
The Take Profit can either be set at a fixed value of 7% or intraday traders may wait for the Stochastic oscillator to reach oversold levels before taking profits.
BackTesting:
On an average, among the stocks we tested, this strategy generated around 20 signals per stock in a calendar year. 1 out of 3 trades were profitable. However, the Reward to risk ratio of 3.5:1 ensured the strategy remained not only profitable but significantly outperformed buy and hold returns on several stocks.
For eg: Asian Paints returned 56% over the calendar year with this strategy compared to 28% for buy and hold.
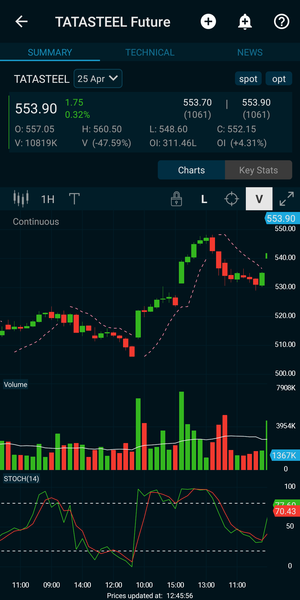
Tata Steel returned 21% compared to a -7% for buy and hold.
Conclusion:
The extremely short term nature of this trade for day traders means that the trader must observe this trade continuously from start to end. The positional trader can however set his stop loss levels and target levels on a day to day basis and monitor the trade occasionally.
Combining this strategy with an additional trend indicator on a higher timeframe (daily) could be further used to improve the reliability of the signals on this strategy.
One could go ahead and set alerts for this strategy on MP as follows and start testing this strategy further on your own.
Our suggestion is that one takes this idea and see how it fits in with your trading plan. The parameters are not set in gold. experiment with the parameters. They can be tweaked for different stocks and different timeframes to produce better results.
Next article, we’re looking at pair of indicators, the Bollinger Bands and RSI to see how best they can be combined for building a profitable trading system.