“The stock is hitting a new 52 week high. Is it a good time to buy it?”This is a common question that has been raised many times in the past.
Interestingly, there has been a lot of academic research done over the years and most of it points towards higher momentum in stocks hitting 52 week highs. It is best summed up from this quote from the most famous paper on momentum investing.
The 52-week high price explains a large portion of the profits from momentum investing. We find that nearness to the 52-week high is a better predictor of future returns than are past returns”
The 52-Week High and Momentum Investing - Thomas George and Chuan Hwang, Journal of Finance, 2004.
Despite the research and data, I’ve observed that most traders tend to lose money trading stocks in these yearly high or low zones. What’s the reason?
Before the advent of internet trading, the 52 week highs/lows were genuine breakouts and the markets continued moving beyond them with more momentum. But over time as more people caught on to this simple method, and speed of information increased, resulted in extreme volatility with false breakouts and this trading edge was lost.
So then, how should one go about trading these stocks in today’s trading environment?

Method
Here’s a step by step method one can follow to trade this method.
- Regularly Scan the markets for stocks hitting 52 week highs and lows.
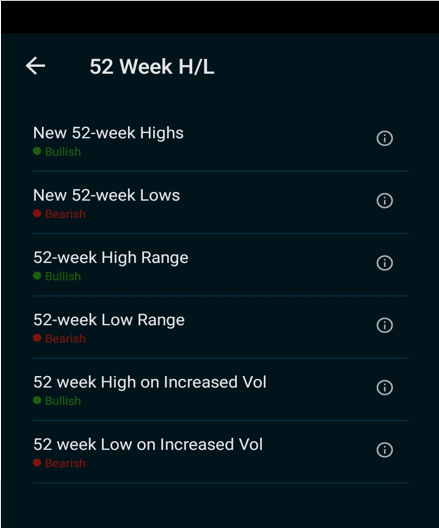
The Market Pulse app has several pre-defined scans that can do this for you namely:
- New 52 week highs/lows
- 52 Week High Range
- 52 week high on Increased Volume
2. Create separate watchlists for Stocks hitting highs and lows respectively.
3. Wait for the pullback away from the range after the stock hits these levels. Look for pullbacks from round figures like 100, 1000 etc. They hold a lot of significance and become strong resistances during such moves.
4. Look for consolidation near previous swing highs or lows. One can use support and resistance zones of the stock to monitor this. I like to also use a dynamic support/resistance zone like the 20 day EMA or 50 day EMA in case of a deeper correction and see how the stock behaves at these levels. This consolidation phase can take anywhere between 2 to 5 weeks.
5. Enter a long position when the larger trend resumes with a tight stop loss below the recent swing low. Most of these breakouts tend to occur in the first hour of trading, so be vigilant during that time.
6. If the stock breaks out above the 52 week high within the next 2-3 trading sessions, the momentum will be on your side and the gains should come in swiftly. If not, trail your stop loss and exit your trades if they hit. Seasoned traders can consider adding to their existing positions on the breakout, but I wouldn’t advise you to do that if you’re just starting out.
7. Most traders tend to focus only on the 52 week highs. I suggest you trade to the downside (the 52 week lows) just as often as you trade to the upside. The momentum is quicker to the downside as opposed to the upside more often than not
8. Pick only stocks that have sufficiently good volumes and have good volatility normally. It’s always risky to pick the illiquid ones. I like to limit myself to the Nifty 200 and more often only to the liquid futures counters.
Case Studies
The figure shows the chart of ABBOTINDIA.
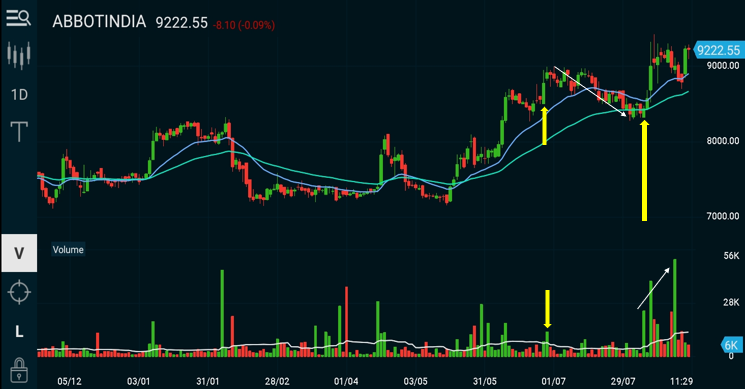
As you can see from the chart, the stock breached its previous 52 week high of 8820 on 26th Jun 2019. After hitting a high of 9000, the stock quickly starts retracing. It finds its first support at the 20 EMA and after a failed attempt for a new high consolidates for a few weeks. It finds its support near its 50 EMA, from where it makes an attempt for a new high with increased volume. The high volume candle on 6th August 2019 would have been a perfect entry point for the 52 week trader to go long at 8439 with a stop loss at 8278.
The figure below shows HEROMOTOCO
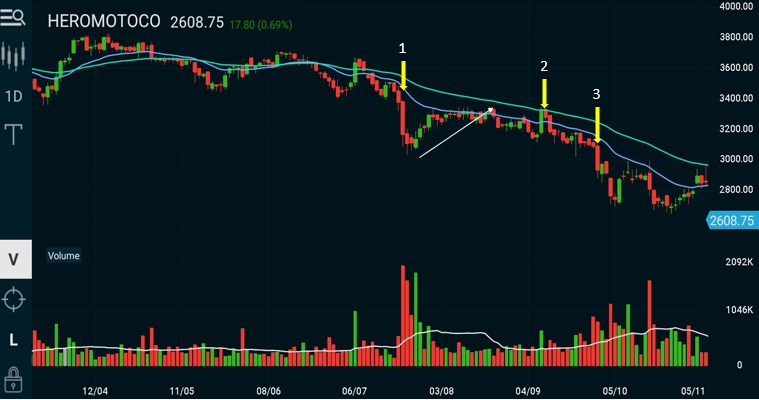
This chart shows the case for a breach of 52 week low. The low was breached on 23 Jul 2018 (1) post which we have a pullback fisrt to the 20 EMA and then the 50 EMA (2) from where the larger trend resumes on larger volumes. A short could have been initiated on 11 Sep 2018 at 3184 with a stop loss at 3345.
A new approach to trading 52 week breakouts.
Conclusion
One must be aware that though this method can be very rewarding, it will need extremely high levels of discipline over several days and sometimes weeks to achieve optimal results. You must review and study your existing list of stocks in the watchlist on a daily basis and update the new ones. There will be stocks that will not fall within your criteria and one should be willing to pass those trades without remorse.
All the best!