Keltner Channels is an envelope based indicator that traders can use to understand the current trend and generate trading signals. The channels uses 3 lines - upper, lower, and middle lines that move with the price, creating a channel-like appearance.
Keltner Channels are a combination of two indicators: the exponential moving average(EMA) and the average true range(ATR). The calculations are shown below:
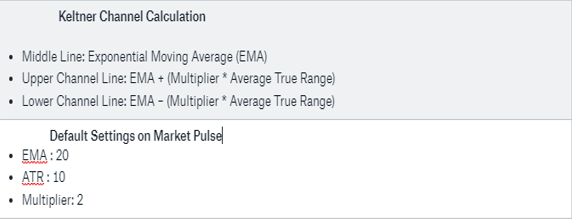
The Keltner channel is created around a moving average using the volatility to determine the possibility of price movement. The upper and lower bands are typically set to two times the ATR above and below the EMA.
Reading Keltner Channel Charts
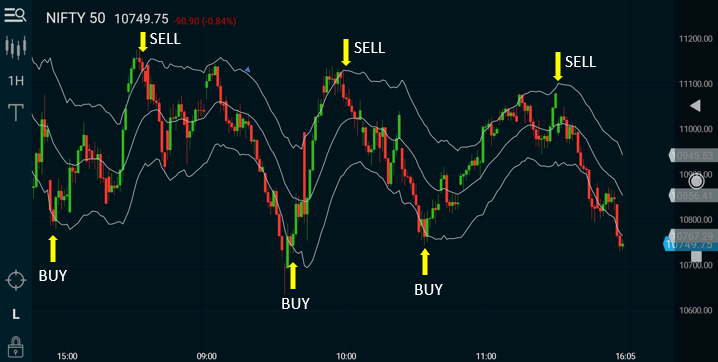
In Fig. 1 above you can see the Keltner Channel (20,10,2) plotted on the Nifty hourly chart. The upper and lower channels act as natural turning points for the market and the middle line acts as a support or resistance once the trend is established. The price staying close to extreme lines for longer periods signifies acceleration of the trend. The direction of the channel, such as up, down, or sideways, shows the trend direction of the asset.
Adjusting the Indicator Settings
EMA
A longer EMA will mean more lag in the indicator. The channels won't respond quickly to price changes. A shorter EMA will mean the bands react quickly to price changes but will make it harder to identify the true trend direction.
ATR
A longer ATR period will mean a smoother and a less volatile channel.
Multiplier
The multiplier can be adjusted based on personal preference. A larger multiplier will result in a wider channel.
The indicator should be set up to assist your trading style specific to an asset. For example, if the price moves higher but does not reach the upper band, then your channels may be too wide and you should lower the multiplier. If the price keeps touching the lower band in an uptrend, your channels may be too tight and you should increase the multiplier.
Comparing with Bollinger Bands
Keltner bands are quite different from Bollinger bands and they must be traded in an entirely different manner. Do not make the mistake of trying to substitute one for the other simply because they look similar at times.
- Keltner Channels are smoother than Bollinger Bands because the width of the Bollinger Bands, based on standard deviation, is more volatile than the Average True Range (ATR). This creates constant width and is better suited for following trends.
- Keltner Channels uses an exponential moving average, which is more sensitive than the simple moving average used in Bollinger Bands.

Scanner Strategies
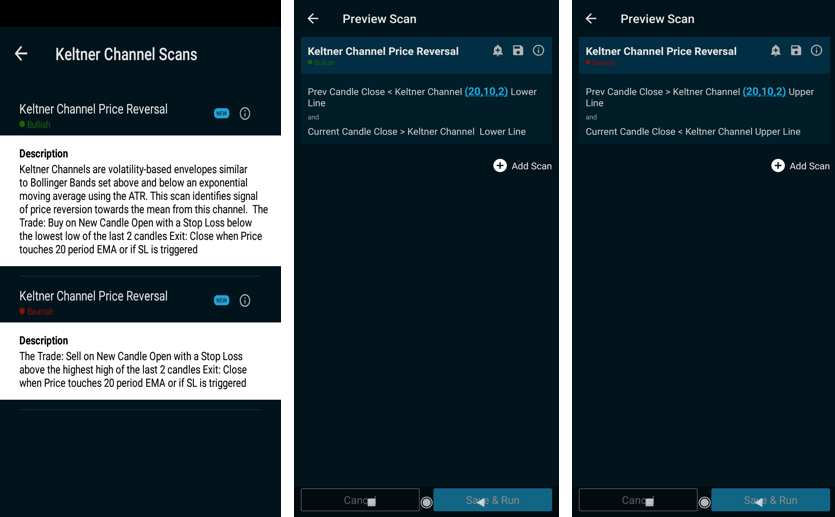
The Market Pulse Scanner has a bullish and bearish reversal strategy that can be used to discover trades. These scans identify price reversion towards the mean from the channel extremes.
Keltner Reversal Strategy - Long
The criteria is to find trades that had closed previously below the lower channel and the latest close is above the lower channel.
The Trade: Buy on New Candle Open with a Stop Loss below the lowest low of the last 2 candles.
Exit: Close when Price touches 20 period EMA or if SL is triggered.
Keltner Reversal Strategy - Short
The criteria is to find trades that had closed previously above the upper channel and the latest close is below the upper channel.
The Trade: Sell on New Candle Open with a Stop Loss above the latest high of the last 2 candles.
Exit: Close when Price touches 20 period EMA or if SL is triggered.
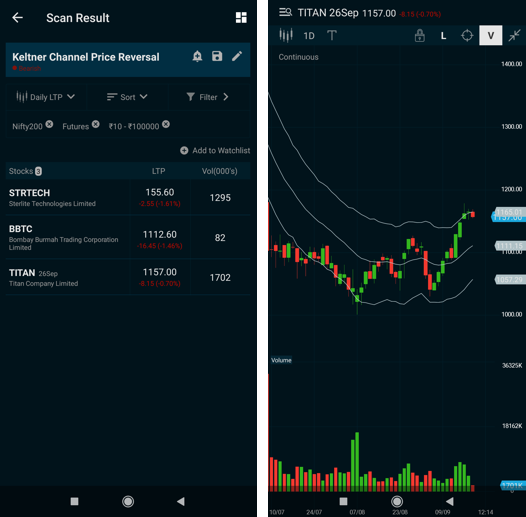
The screenshots below show you how can go about using the Scanner.
Conclusion
Keltner Channels are useful in analyzing trend direction. However, I would recommend using them with price and volume action. Consider adding a volume filter to your Scanner to improve your trading results. You must also see the charts and adjust your Keltner Channel settings slightly for each asset. The settings you use on one asset may not necessarily work, or be the best settings, for another asset.