In the previous article, we understood how the Chaikin Money Flow(CMF) can be a useful tool in combining volume with price to determine the strength of a trend. The Chaikin Money Flow can also be very effective for investors who are looking at intermediate and longer term trends in stocks.
This article will cover :
- How Can Long Term Investors Benefit From Chaikin’s Money Flow
- Comparison with Money Flow Index (MFI)
- Drawbacks
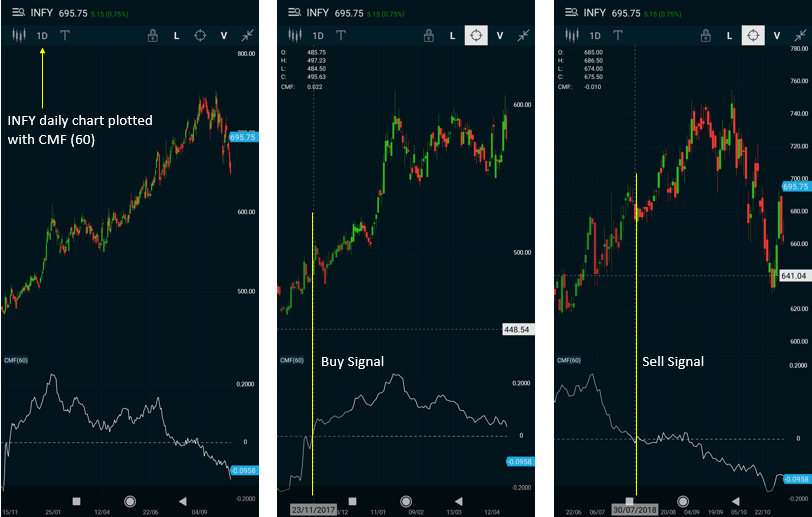
The default period of the CMF at 20 is more suited for short term trading. I would recommend using CMF periods in the range of 60 to 120 for your longer term chart studies. In this daily chart for INFY, plotted with the CMF(60), you can see based on a simple rule of CMF crossing above zero signaling a buy and CMF crossing below zero signaling a sell, would have given us an entry on 23/11/2017 at 495.60 and a exit on 30/07/2018 at 675.50 helping us capture a large portion of the uptrend.

One can keep these aspects in mind, while using the Chaikin Money Flow for your long term studies:
1. CMF Persistency
When identifying buy candidates, look for evidence of strong money flow persistency, meaning significant regions of green over the last 6-9 months. Generally, Money Flow should correlate with price movement over time – as price goes up, money flow should, on average, get more green, and as the closing price goes down over time, money flow should get more red.

2. CMF Divergence
A money flow divergence occurs when a price move is not accompanied by a similar change in Money Flow. A negative money flow divergence can be an important indication of potential short-term risk, or help identify potential short candidates. So, if a stock has a short-term price rally and Money Flow stays noticeably red, this indicates a higher likelihood of a pullback.
3. Relation to Institutional Activity
Chaikin Money Flow can be a good way to identify the behavior of large institutional investors – such as pension funds, mutual funds, and hedge funds – without directly tracking their order flow. This is because large institutions are disproportionately responsible for a “closing effect” on price. Early in a trading session, institutional investors will be less likely to expose large blocks of shares to trade, which can move the market against them.
As the session nears its close, however, they get more aggressive in getting their orders filled, bidding stocks higher if they are buying, or accepting lower offers if they are selling—thus creating a subtle but noticeable “closing effect,” which is more present than with retail order flow. Chaikin Money Flow is effective in measuring this effect, helping indicate the “true” buying and selling pressure of the institutions who move markets.
Conclusion
Chaikin’s Money Flow is an important technical tool that gives the analyst a different perspective on buying and selling pressure in the markets. Ideally, the results can be further improved by combining it with other indicators like moving averages, RSI, Stochastic RSI and so on. Try it as a test case on the INFY chart we discussed and see for yourself.
Market Pulse is now available on iPhone
