The dynamic momentum index is a momentum indicator used to determine if an asset is overbought or oversold. It was first recommended by Tushar Chande and Stanley Kroll in the Stocks and Commodities Magazine in May 1993.
It is very similar to the Relative Strength Index (RSI) in most aspects. The main difference between the two is that the RSI uses a fixed number of time periods (usually 14) in its calculation, while the dynamic momentum index uses different time periods as volatility changes, typically between five and 30.
We have referred to the dynamic momentum index as DyMoI on the Market Pulse App for brevity, but should not be confused with the directional movement index (DMI).
Let’s take a look at how to use the DyMoI and its limitations. I’ve also shared the calculation methodology for this indicator at the end of the article.
How To Use The DyMoI Indicator?
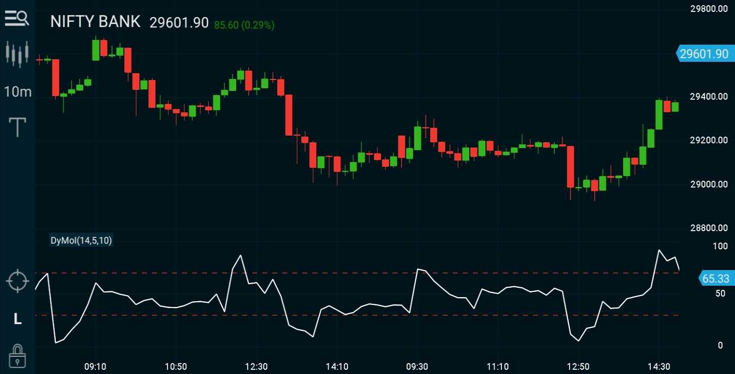
- The interpretation is similar to RSI. Readings below 30 indicate oversold, and levels over 70 are overbought. The indicator oscillates between 0 and 100.
- The indicator uses fewer time periods as the volatility of the security increases making it more responsive than the RSI. Thus, traders can potentially find earlier entry and exit points than with the RSI.
- During an uptrend, traders can watch for the indicator to fall below 30 and rise back above in order to trigger a long trade.
- During a downtrend, watch for the indicator to rise above 70 and then fall below it in order to trigger a short trade.
- 30 and 70 are general levels and can be altered by the trader. For example, a trader may opt to use 20 and 80 instead.
- This indicator is also more useful at key support/resistance areas and retracement levels as the security tends to become more volatile indicating potential trade signals.
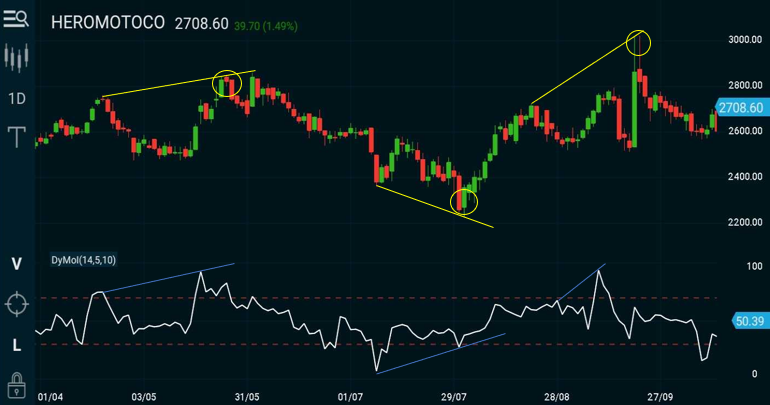
How to Use the Dynamic Momentum Index
In the chart below, the circled areas show potential trade setups in HEROMOTOCO using the dynamic momentum index with divergences. The first and third circles denote negative divergences where the price makes a new high but the DyMoI makes a lower low. The second circle denotes a case of positive divergence where the indicator makes a higher low when price retrieves from a lower low.
Traders could place a stop-loss order either above the most recent swing high for short trades and below the most recent swing low for long trades to prevent a loss if the trade moves against them.
Limitations of DyMoI
- The indicator is looking at past price movement. It is not inherently predictive in nature.
- While the indicator lags less than the RSI, there is still some lag.
- When prices are falling an asset can remain in oversold territory for a long time. The indicator moving out of oversold territory doesn't mean the price will rise significantly. Similarly, with an uptrend, the price could stay overbought for a long time, and when it moves out of overbought territory doesn't necessarily mean the price will fall.
Consider using this with as additional trend following indicator for better results.

Calculating the DyMoI
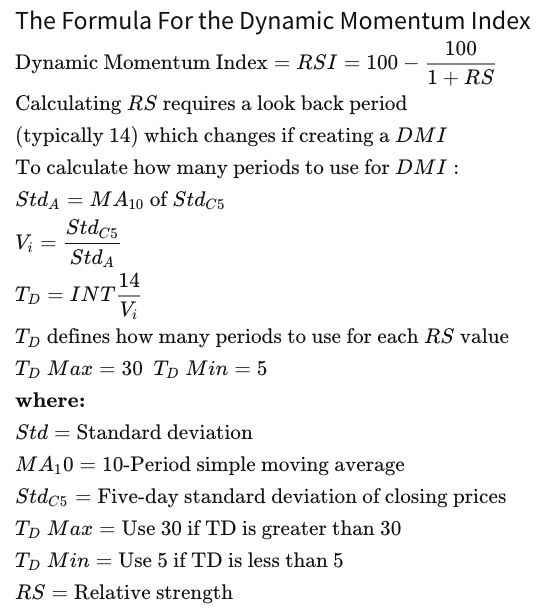
How to Calculate the Dynamic Momentum Index
The dynamic momentum index uses the RSI formula, but the DMI uses a varying look back period, between 5 and 30 for each calculation of RS, whereas the RSI typically is fixed to 14. To find the look back period required for each calculation of RS when calculating DMI, use the following steps:
- Calculate the standard deviation of the last five closing prices.
- Take a 10-period moving average of the standard deviation calculated in step 1. This is StdA.
- Divide step one by step two to get Vi.
- Calculate TD by dividing 14 by Vi. Only use integers for the result, as these are meant to represent time periods and therefore can't be fractions or decimals.
- TD is limited to between 5 and 30. If over 30, use 30. If under 5, use 5. TD is how many periods are used in the RS calculation.
- Calculate for RS using the number of periods dictated by TD.
- Repeat as each period ends.