The Zig Zag is a tool rather than an indicator as it does not predict price movement or give signals to buy or sell. The usefulness of the Zig Zag can be attributed to three important qualities.
- It is an effective noise filter,
- It graphically presents the main trend with great clarity, and
- It is still a very low-level indicator, as the price is not filtered through a complex calculation but is based upon the price itself.
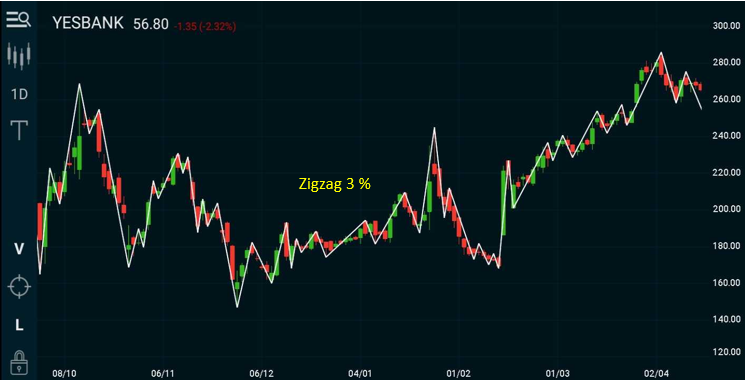
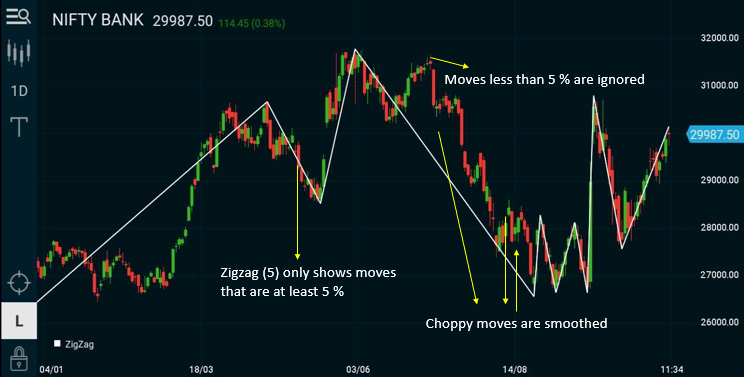
One of the difficulties for traders is to stay with a trending market because reactions against the trend tend to force them out of their positions. The ZigZag tool filters out price movements less than the set percentage and is plotted as a straight line over the chart.
Plotting Zig Zag
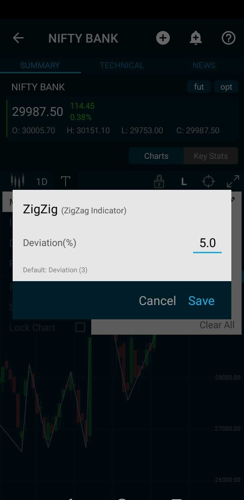
The ZigZag is calculated based on the closing prices of the time frame being used. The user can set the percentage of price movements that should be marked on the chart. The default value is 3%.
How Zig Zag Works
The percentage amount set by the user is a reversal threshold. Thus, if a reversal in price trend fails to follow through to this level, Zig Zag will remain unchanged. The apparent upswing or downswing will be filtered out and the previous trend will appear to continue without interruption. Once the price reversal has reached or exceeded the threshold, a new Zig Zag level is marked, and the algorithm searches for a reversal in the opposite direction.
Sensitivity
The sensitivity of the ZigZag will depend on the percentage setting. A smaller percentage will result in a more lines with more changes in direction. It is important, therefore, to experiment on past trends of the stock or commodity you track to decide a “right” percentage setting - one that keeps the trader in the market for a large part of the trend and highlights changes on chart.
DayTrading With Zig Zag
The Zig Zag can be used in any time frame but the percentage must be set accordingly. A shorter time frame will require a shorter percentage setting. A 15 minute intra-day Nifty chart of the one should set it to 0.25% or 0.50% as larger moves are insignificant for the day trader.
Uses
The Zig Zag is often used on charts for spotting:
- Trends
- Tops & Bottoms
- Support & Resistance Zones
- Elliott Wave Counts
- Trend Retracements
- Fibonacci Levels
- Harmonic Patterns
- Wolfe Waves and so on.

Limitation
The Zig Zag can’t foresee into the future and tell you precisely when the market is about to shift direction. There is also a delay of a few bars, before it commits to drawing the last line on the chart. The newest line on the chart does not update until the indicator decides that the market has hit a new point based on the percentage set by the user. And at that point it commits and fixes the line and then starts looking for a new one. This means that the newest line on the chart will move around until the algorithm is sure that the market has reached a turn rather than a minor price correction.
Even though the Zig Zag indicator is not predictive, it is still very useful. It is often used in conjunction with applications such as Elliott wave counts. Analysts can also use the historical highs and lows to draw lines to identify Fibonacci projections and retracements. Chart patterns such as double bottoms, double tops, and head and shoulders can also be determined.
This is our latest article in the series on New Technical Indicators. Read the previous article here